The Climate Scoreboard
In the current environment—where nationalism is on the rise—solidarity is not likely to cross national borders. Even when it comes to addressing the critical challenge of climate change, national interests are likely to dominate responses. This is particularly true of global powers, the United States and China, whose economic and technological interests are competing for dominance. For both superpowers, the nation state is the master discourse that legitimizes the climate discourse.
Being geopolitical superpowers in international affairs has an effect on climate change negotiations, as we have seen in debates where both China and the United States have pursued economic competitiveness, or energy security or “energy dominance,” even at the expense of climate action. Superpower rivalry plays a real role in international climate talks, and China and the United States have, thus far, primarily used their power to subordinate climate action to national economic and geopolitical interests.
The sheer size and economic weight of China and the United States also means that they are climate superpowers by dint of their potential to mitigate climate change: China and the United States account for roughly 30 percent of global economic output and are responsible for 43 percent of cumulative carbon emissions (see Chart 1).
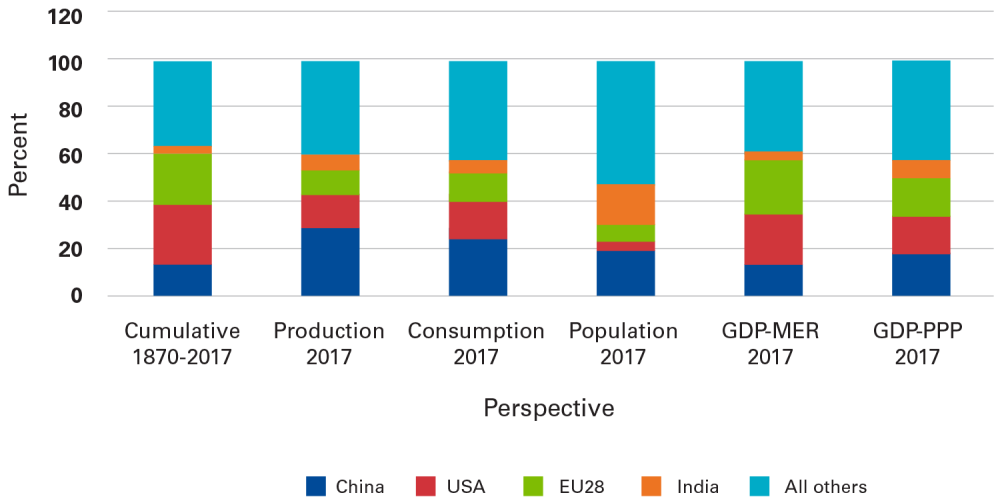
In 2019, China was the top emitter, accounting for 28 percent of global carbon emissions, with the United States in second place with 15 percent of emissions. Inevitably, the economic and technological competition between China and the United States will strongly influence the effort to climate-proof the world.
This is not necessarily a bad thing. Competition between superpowers can accelerate progress in identifying economic and technological pathways to decarbonization. Climate change provides an opportunity for both the United States and China to increase cooperation and signal their commitment to the rest of the world, even if hostility persists in other spheres of engagement. The history of the United States and the USSR working together in the area of space research, despite being at the opposite ends of the Cold War, offers hope for cooperation between China and the United States on responses to climate change.
Participation in Multilateral Agreements
In 2017, when the United States announced its withdrawal from the Paris Agreement, China was largely credited with taking over leadership on climate action by virtue of its endorsement of the agreement. This was despite the fact that China’s Nationally Determined Contribution (NDC) to the Paris Agreement was substantially less ambitious than it should have been on the basis of fairness and equity, and despite the fact that China, together with India, accounted for more than half of the increase in carbon emissions in 2017.
The 2015 Paris Agreement gave every country in the world the ability to set its own goals to prevent a 2℃ increase in global temperature by the end of the century. The agreement is legal in character and contains provisions for reviewing the NDCs every year to move the cumulative contributions closer to the goal of limiting temperature increases. However, the NDCs are often described as vague, aspirational, and unenforceable; the Agreement’s provisions for monitoring, reporting, and verification are far from watertight; and the mechanisms to support poor countries are under-developed.
In the elegant framework of Robert Putnam’s two-level games theory, China’s NDCs leveraged the strengths and weaknesses of the Paris Agreement to pursue domestic and international goals while minimizing economic compromises. China’s emphasis was on economic costs and international reputation. As a superpower in waiting, the prestige and soft power that comes with being part of a multilateral agreement mattered more to China than to the United States.
As a democracy, the U.S. approach to multilateral agreements has been more fluid, reflecting the ideological changes in the country’s leadership. Years of effort to improve bilateral climate cooperation with China under the previous U.S. administration led to a joint statement by China and the United States in 2014 where both announced their 2030 climate targets. This paved the way for China’s participation in the Paris Agreement. The current administration chose to upset the Paris table, taking advantage of domestic politics to legitimize its hawkish approach internationally. As the reigning superpower, the United States could afford to shun moral high ground and adopt positions that give primacy to the market over the state. This position may yet be altered when the country’s leadership changes in the future. Technically, under Article 28 of the Paris Agreement, the United States will remain under the Paris Agreement until 5 November 2020. Ironically, this date falls two days after the U.S. presidential election, in which commitment to the Paris Agreement may play a role.
Notwithstanding the decision of the current U.S. administration to withdraw from the Paris agreement, 15 U.S. states and territories have taken legislative or executive action to move toward a 100 percent clean energy future. The bipartisan U.S. climate alliance coalition of 24 state governors—representing more than half of the U.S. population and an $11.7 trillion economy that would be the third-largest in the world—is committed to reducing carbon emissions by 26-28 percent below 2005 levels by 2025.
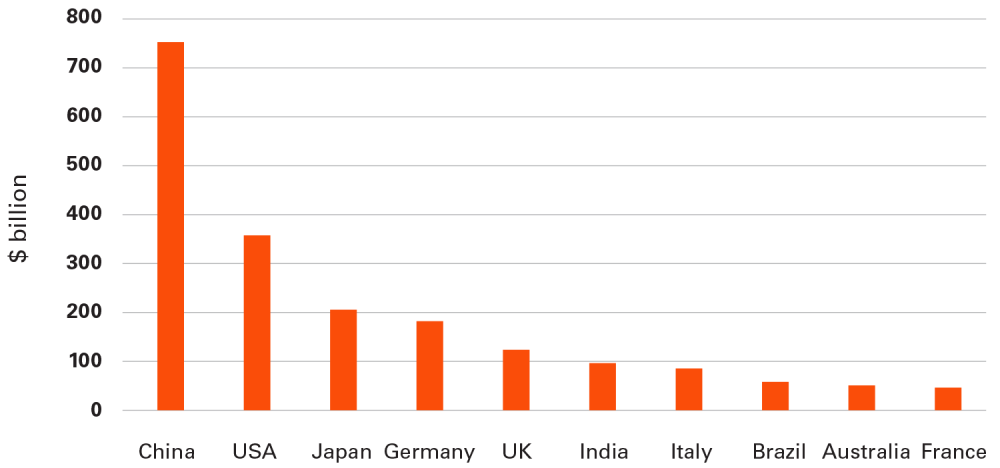
Overall, both the United States and China are moving towards a low carbon future, although the motivations and mechanisms for action differ (see Chart 2). As a wealthy liberal democracy, the United States is more dependent on democratic choices of its people and the outcome of market competition between technologies. China, on the other hand, is a middle-income country that depends more on executive mandates on governance and technology to achieve roughly the same goal of decarbonization.
Harnessing Markets
The United States is the largest producer and consumer of oil and gas and the second largest producer and consumer of fossil fuels (oil, gas, and coal) after China. In 2018 the United States produced more than 15.3 mbpd (million barrels per day) of oil, compared to the 12.2 mbpd of oil that Saudi Arabia produced. That same year, Russia—the largest exporter of gas—produced about 670 bcm (billion cubic meters) of natural gas, while America produced over 830 bcm of natural gas (see Chart 3). The ability to harness technology and capital to bring domestic energy resources into production influences the United States’ regional development, environmental quality, and national security through energy and climate policies.
Domestic energy production that reduces energy imports has always been a component of U.S. national security. This idea, captured in the slogan “energy independence,” has influenced U.S. energy policy for over four decades. Under the energy independence narrative, actors with economic and political interests in the domestic natural resource industries were able to present any commitment to reduce carbon emissions as a threat to national security. The slogan of “energy dominance” adopted by the current government is broader as it includes the idea of the United States emerging not just as a large energy producer, but also as a large exporter of energy, particularly of oil and gas.
Producers of gas from shale plays are highly exposed to swings in oil and gas prices, as the current COVID crisis has demonstrated. With gas demand plunging after the lock-down, taking with it the price, gas production from U.S. shale resources has decreased dramatically and some large companies have filed for bankruptcy. However, shale plays can return to production in a very short time if oil prices rebound, which illustrates the influence of markets over the U.S. oil and gas sector.
Market forces that strongly influence the production and flow of domestic energy resources are driving critical shifts in the United States’ fuel basket, with the unintended side benefit of reducing carbon emissions. In the 1980s and 90s, the United States was referred to as the Saudi Arabia of coal as it had a quarter of world coal reserves, the largest in the world. In 2000, when coal accounted for roughly 50 percent of power generation, the U.S. electricity industry believed that the transition away from coal would be very expensive, and potentially impossible. Unlike oil and gas production, which is largely confined to four states, 26 states produced coal and thus there was greater political opposition to a shift away from coal.
Yet in the last two decades, relatively cheap natural gas combined with the higher efficiency of gas-based power plants has substantially displaced coal in power generation. In 2015, the share of coal in power generation fell to 35 percent, with gas increasing its share to 32 percent. Since gas-fired power plants emit half as much carbon as coal plants, in 2015, the U.S. emissions were 21 percent lower than 2005 levels—the lowest emission levels since 1993. In 2019, coal accounted for just 23 percent of power generation.
A similar transition has already begun to displace both coal and gas in favour of solar and wind for power generation, though this shift was not entirely driven by the market. State interventions in the form of tax credits for clean energy at the federal level and mandates to absorb clean energy through portfolio standards, net metering, and feed-in-tariffs at the state level[1] are pushing investment in clean energy that could eventually displace natural gas.
In 2018, the United States generated 10 percent of its electricity from clean energy (not including hydro and nuclear), higher than the 8 percent share in China, though China generates more electricity from clean sources in absolute terms. As of 2018, U.S. carbon emissions were 10 percent below its 2005 levels, which is roughly two-fifths of the way to the Paris Agreement target of 26 percent below 2005 levels by 2025. Coal-to-gas switching accounted for 33 percent of the reduction while structural changes in demand for energy accounted for another 30 percent. Clean energy was responsible for 20 percent of the reduction; efficiency, along with a fall in transportation demand (surface and air), accounted for 15 percent.
The market cannot take all the credit for displacing coal in favour of gas. Tough environmental regulations on coal plants under the Obama administration assisted the switch to gas. Moreover, the unconventional gas (shale gas) production that is behind the United States’ coal-to-gas switching is the result of substantial federal investment in research on fracking and horizontal drilling in the 1970s. Nevertheless, coal-to-gas switching has not arrested growth in carbon emissions. In 2019 carbon emissions from gas use in the United States reached 1.7 GT (giga tonnes) which was a 3.5 percent increase over emissions in 2018, while emissions from coal decreased by 10.5 percent to 1.1 GT.
At the federal level there are no market-oriented instruments for carbon reduction, such as cap-and-trade[2] or a carbon tax. These instruments could potentially reduce emissions at a lower social cost (the monetary estimate of damages associated with an incremental increase in carbon emissions in a given year) than a more prescriptive regulatory approach due to the greater flexibility that they offer in determining how to reduce emissions. However, it is not easy to accurately determine how the costs of a market-oriented climate policy will be distributed across households with different consumption patterns and levels of wealth. Because of the large uncertainties in the effects of climate change and the subjectivity of the discount rate, estimates of the social cost of carbon differ widely, from $10.2/ton to $105,213/t. Anecdotal evidence from protests against taxes on fossil fuels in France and Australia highlights the complexity in imposing market-based solutions to address climate change.
U.S. reliance on markets has so far pushed the energy sector towards lower-carbon fuels. Nevertheless, the critical force behind decarbonization was American public investment in the production of knowledge and technologies that were leveraged by capital to produce lower carbon energy. Investment in research and development by the United States is a public good that makes a huge contribution in shaping technological responses to climate change.
Imposing Mandates
In 2018, China produced more coal than the United States produced oil and gas in energy equivalent terms. Electricity generated from cheap coal supports relatively low cost export-oriented manufacturing in China that is key to its economic success. China’s coal demand is expected to plateau by 2022, but this is not necessarily because of its Paris pledges.
China’s solar energy program, the biggest in the world today, was initially designed to meet low-end demand for electricity from rural households. China leveraged this manufacturing capability to respond to high-end demand for solar panels from Western Europe in the 1990s. Provincial and local governments generated skilled and semi-skilled jobs by setting up solar manufacturing facilities, leveraging funding support for “strategic industries” from the central government. Economies of scale from this expansion led to a dramatic reduction of solar panel and module cost for renewable energy consumers initially in Europe and eventually in other parts of the world. From a climate perspective, this cost reduction is a public good because relatively poor countries can now afford large clean energy projects thanks to imports of cheap clean energy equipment from China.
In the early stages of solar manufacturing, China catered to markets in Western Europe, which tended to create excess capacity as European policies to subsidise installations of solar panels kept changing. The need to absorb excess capacity drove domestic installations of solar panels in China.
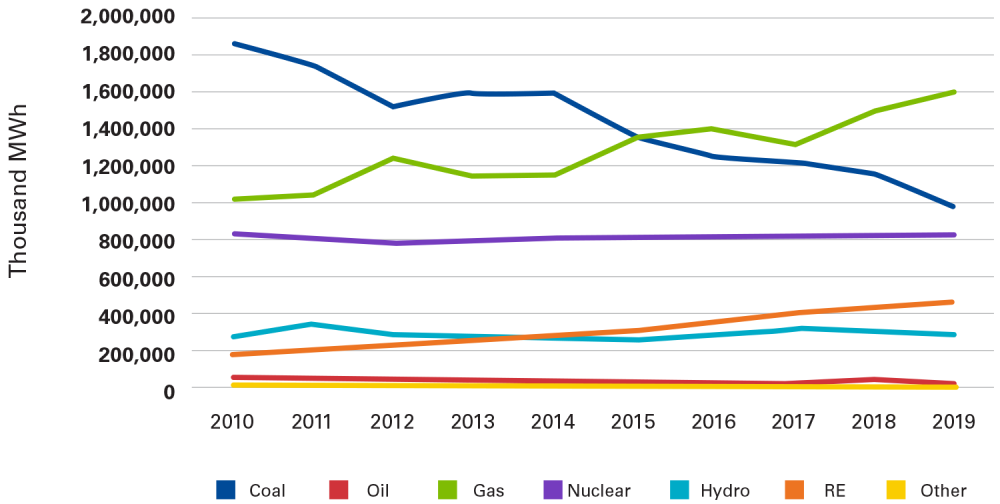
Following Germany’s lead, China introduced attractive feed-in-tariff[3] to promote the domestic use of solar energy in 2013, and by 2015 China surpassed Germany as the largest market for solar energy in the world. China’s wind energy industry traced a similar path, as acquisition of small German companies with cutting-edge wind turbine technology eventually put China in the lead. China’s leadership in electricity storage and electric vehicles is now following a similar approach, with rapid acquisition of technology and resources to scale manufacturing to meet state and federal level mandates and targets. China now easily takes all the prizes in the production and consumption of clean energy (see Chart 4).
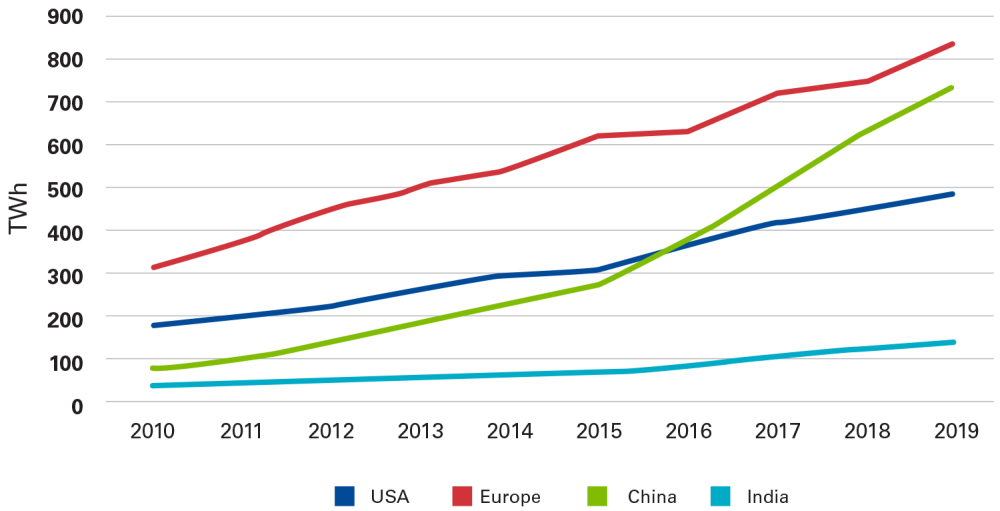
China derives its economic strength more from the size of its population than from the economic efficiency and knowledge-driven productivity that supported U.S. power after the Second World War. At $15,376 (in purchasing power parity in current international dollars), China’s per person income was a quarter of the United States’ per person income in 2018. China is keen to catch up on this vital economic parameter, irrespective of whether this is fueled by brown or green energy. It was to this end that China built clean energy manufacturing capabilities. Essentially, China leveraged its industrial policy in its climate and clean energy policies—not the other way around.
From China’s economic vantage point, the global conversation about climate change has moved from “well-intentioned” environmentalism to the future geopolitical international economic order, and not investing in low carbon energy sources would affect China’s economic and trading competitiveness. Trade barriers in clean energy, such as the carbon related border adjustment taxes proposed originally in the American Clean Energy & Security Act 2009 and now pursued by the European Union, suggests the possibility of “green-marginalization” of China. The heavy investments in clean energy manufacturing by China in the last two decades sought to avoid tariff barriers to its exports manufactured using fossil fuel based energy. Notwithstanding the motive, the means (clean energy manufacturing) has benefited the world with substantial scaling of low cost clean energy production.
However, China is also facilitating the expansion of fossil fuel use in countries under the Belt & Road Initiative (BRI), which may be counterproductive to addressing climate change. In 25 of the 65 countries under the BRI initiative, China is reportedly involved in 240 coal-fired power projects of about 250 GW capacity, roughly equal to current coal-based power generating capacity in the United States. It is important to note here that the key driver of the decision to use coal-based power by relatively poor BRI countries such as Bangladesh, Mongolia, and Vietnam is driven by cost rather than indifference to climate commitments. Though these countries are exposed to climate-related disasters, the concern that the costs of mitigating climate change by reducing emissions could slow down their economic catch-up overrides their climate concerns.
This highlights the critical question of economic inequality between countries and the consequent need for financial assistance from richer to poorer countries to address climate change. Article 4 of the UN Framework Convention on Climate Change (UNFCCC) echoed Article 9 of the Paris Agreement by calling for financial assistance to poor countries to address climate change. Available evidence shows that climate finance grants to poor countries are far lower than the $100 billion promised by developed countries. This could be an opportunity for the United States and other developed countries to offer grants for clean energy to BRI countries under the climate finance mechanism. It is very unlikely that these countries would opt for loan-based coal projects offered by China under BRI if a cheaper clean energy alternative were made available.
Technology Innovation
The most recent report of the IPCC (Intergovernmental Panel on Climate Change) observes that the share of clean energy must increase to 52-62 percent of global primary energy supply by 2050 to limit global average temperature increase to 1.5℃. Industrialised countries have responded by increasing research and development (R&D) spending in clean energy technologies in the past few decades to stay ahead in the race.
The United States, China, Japan, France, and Germany were the five leading countries for public spending on energy R&D in 2018. These five countries accounted for around 70 percent of all such spending worldwide. In 2018, China’s energy R&D budget grew most in absolute terms, with spending on clean energy and higher-performing fossil fuel technologies increasing the most. The U.S. budget for energy R&D also increased by more than 12 percent in 2018, with notable increases for solar energy, hydrogen, and alternative vehicle technologies. However, the share of China based start-ups in total venture capital value for early-stage energy technologies overtook the traditionally dominant United States, with Chinese companies receiving over half of the deal value.
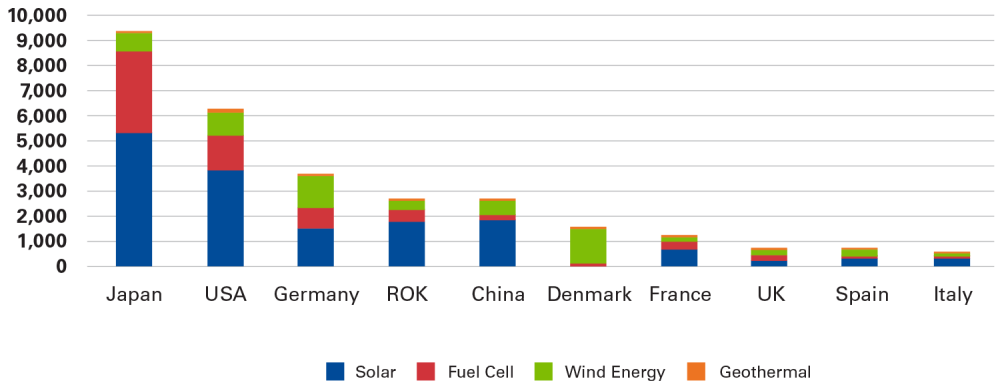
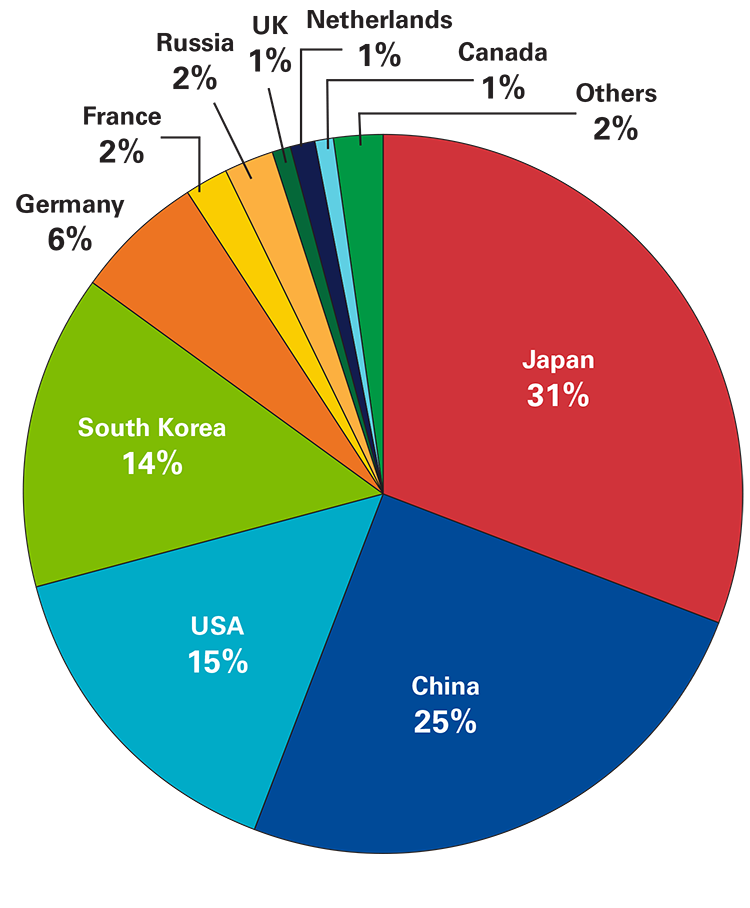
According to WIPO (World Intellectual Property Organisation), patents for clean energy technologies account for only 1 percent of overall patent applications, but these applications grew by 546 percent between 2002 and 2012. That growth has continued: in the period 2010 to 2019, Japan led the table for clean energy technologies with 9,374 applications, followed by the U.S. with 6,300 (see Chart 5). China was in fifth place with 1,659 patent applications, with Germany and South Korea taking third and fourth place respectively. However, China’s patent applications increased substantially in the second half of the decade (2015-19) to 1,522 applications, pushing China to third place after Japan (3,114 applications) and the United States (2,247 applications). In the period 2013-17, China was the undisputed leader in applications for clean energy patent families with 45,472 applications (see Chart 6). Patent families offer greater potential for commercialization as patents cover more jurisdictions.
China’s emerging dominance in R&D investment in clean energy (and other sectors) need not be interpreted as a threat, especially when seen through the climate change lens. In investing in R&D, China is merely imitating the United States’ post-war state-led industrial policy that facilitated its growth as an industrial powerhouse. The state-led development of the United States, based on Hamiltonian economic philosophy, held that a big country needs big organizations to succeed and that the federal government in particular should collaborate with private enterprise to build infrastructure and finance scientific research. The only difference is that China is much larger and its pace of change much faster. However, climate change can benefit from rapid changes, especially when it comes to replacing fossil fuels with low carbon energy from wind and solar plants.
The claim that solar and wind electricity is cheaper than fossil fuel-based electricity and can therefore compete with traditional grid based power without state assistance is only partially true. At the system level, where dependable electricity must be supplied 24 hours of the day, all days of the year, and across all geographies, clean energy is not necessarily cheap as it requires back-up energy sources. For clean energy to realistically compete with traditional grids, battery technologies that store electricity for back-up must become much cheaper and more efficient, or intelligent networks that monitor and displace demand to match supply must be developed.
The UN Environment Programme (UNEP) calculates in its annual “emissions gap” report that, in the 2020s, the difference between what countries have pledged to the Paris Agreement and what is necessary to limit warming to 2℃ degrees is 13 to 15 GT of carbon annually. To bridge the gap, all countries will need to reduce carbon emissions between 5 and 8 percent a year, something no country has ever achieved. No natural rate of technology substitution, even assuming the best possible cost projections, will be fast enough to meet the 2℃ target by the end of the century.
The critical need for rapid technological innovation can benefit from the advantages that China has over the United States: its massive domestic market, its centralized power, and its willingness to employ state-sponsored industrial policy and government support. The expansion of scientific and technological capabilities in China has created a more multipolar global scientific landscape. In a multipolar scientific landscape, the big challenge is to institute traffic systems between China and the rest of the world to reduce transaction costs by ensuring that everyone plays by the same rules.
In the future, China and the United States may cooperate, reinforcing their strengths to address climate change much like the technological cooperation between the United States and USSR during the Cold War. While there were of course long periods of mistrust and overt hostility between the United States and the USSR between 1957 and 1991, there were also periods of accommodation that led to the many cooperative agreements in arms control. It is not rational to rule out similar agreements between China and the United States in the context of climate change.
Conclusion
China and the United States are actively working to retain their leadership in a decarbonising world. In the near term, competition between the two dominant powers can accelerate progress in finding economic and technological pathways to decarbonization even if economic competitiveness and energy security are the primary goals. US energy markets have harnessed public investment in clean energy technologies and made inroads into traditional energy markets dominated by fossil fuels. China’s clean energy manufacturing capabilities, developed to maintain its competitive edge, have lowered the cost of decarbonization for relatively poor countries. Both countries have independently created public goods in the form of clean energy technologies that have helped the whole world to address climate change.
As clearly demonstrated by responses to COVID-19, sovereign efforts, while necessary, are not sufficient to address climate change, a complex planetary problem. Even the most self-interested nation cannot deny that a globally coordinated response to the pandemic led by the superpowers would have substantially reduced public health and economic costs for all nations. Responses to climate change are not likely to be any different if solidarity is forged on a global scale for common and sustainable life.
[1] As of October 2019, 39 states and the District of Columbia have state-developed mandatory net metering that facilitates installation solar panels on private properties.
[2] Some American states and the European Union have put in place carbon emissions trading schemes. China is also planning to implement a carbon-trading scheme.
[3] Feed-in-tariff is the price offered to roof-top or equivalent private producers of solar electricity who sell into the grid. This is generally higher than the average electricity tariff which serves as an incentive to install solar panels and generate solar electricity.
Author

Environmental Change and Security Program
The Environmental Change and Security Program (ECSP) explores the connections between environmental change, health, and population dynamics and their links to conflict, human insecurity, and foreign policy. Read more

Explore More
Browse Insights & Analysis
Can Climate-Resilient Agriculture Become an Engine for Syria’s Post-Conflict Recovery?

ECSP Weekly Watch | March 10 – 14

ECSP Weekly Watch | February 17 – 21


